Quality Control
Every sample submitted to the Genomics Core for sequencing will undergo a variety of quality control (QC) procedures. QC measures are necessary not only to verify the integrity of submitted samples, but also to ensure that every sequencing run produces the best quality data possible.
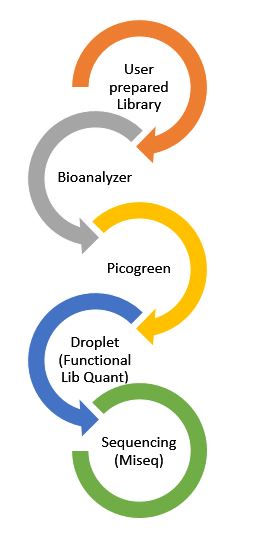
Samples submitted to the GC for sequencing on the MiSeq will be checked for quality by the Agilent 2100 Bioanalyzer or Agilent 4200 Tapestation, initial quantity on the Gen5 Microplate reader with Picogreen, and functional library quantity via QX200 Droplet Digital PCR System.
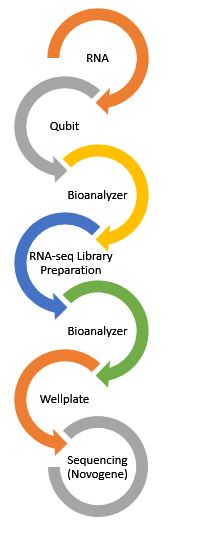
Samples submitted for HiSeq/Novaseq sequencing off-site will be checked for quantity on the Quibit or Wellplate and for quality on the Bioanalyzer or Tapestation before leaving the facility. This step is necessary to avoid lost time due to poor quality samples being sent to another core facility. It is highly recommended by the GC that all proper quality checks (see below) be performed to avoid spending funds on unsuccessful sequencing runs.
Disclaimer
You will be notified immediately if your sample(s) fail QC. If warranted, you may submit additional sample for processing, however, we may require an additional round of QC to ensure that the sample is sufficient for cluster generation and will yield quality sequences.
If your sample(s) fail QC and you still wish to proceed with sequencing, we require
a written acknowledgement stating that you have been notified of the QC failure and
still wish to continue with sequencing. You will be responsible for all costs for
the requested services regardless of the outcome.
Qubit
Flurometric methods use fluorescent dyes to quantitate biomolecules of interest. The fluorescent dyes emit signals only when bound to specific target molecules, even at low concentrations. The Qubit Fluorometer is ideal for downstream sequencing applications as it provides precise quantitation of DNA and RNA sample concentrations by binding to and measuring only intact pieces of genomic materials. All RNA or DNA submitted to the GC will be quantified using the Qubit.
Wellplate Reader with Picogreen
This fluorescent method uses a wellplate reader and the Picogreen kit to allow precise quantification of purified dsDNA samples. It is highly sensitive and slected for double-stranded DNA. All libraries submitted to the GC will be quantified using the Wellplate reader.
UV-Vis Spectrophotometers
260/280
Both DNA and RNA absorb light efficiently, providing a simple way to estimate purity and quantify nucleic acid concentration. DNA and RNA have an absorption maximum at about 260 nm. Sample concentration can be accurately determined using the Beer-Lambert law, which predicts a linear change in absorbance with concentration.
The ratio of absorbance at 260 and 280 nm is commonly used to assess sample purity. Since proteins (aromatic amino acids) absorb strongly at 280 nm, the 260/280 ratio provides a measure of nucleic acid purity. A ratio of ~1.8 is considered "pure" for DNA while a ratio of ~2.1 is considered "pure" for RNA. If the ratio is significantly lower than the aforementioned value for either sample type, it may indicate the presence of proteins, phenols, or other contaminants that absorb strongly near 270-280 nm.
260/230 and 330 nm
The 260/230 ratio is used as a secondary measure of nucleic acid purity. Expected 260/230 values for "pure" DNA and RNA range from 2.0-2.2. If the ratio is lower than expected, it may indicate the presence of organic contaminants. Additionally, "pure" DNA and RNA should have 0 absorbance values at 330 nm. Absorption at 330 nm and above indicates absorption by particulates suspended in the sample.
An Important Consideration
Although UV absorbance readings provide a way to measure DNA and RNA sample concentrations, we do not recommend that this method be used to quantify samples being used for downstream sequencing. UV-Vis spectrophotometers (e.g. NanoDrop) cannot distinguish between DNA, RNA, free nucleotides, or other contaminants, leading to overestimation of sample concentrations and insufficient input quantities for library preparations This can lead to improperly prepared libraries, gross under-clustering during sequencing, and poor quality sequences.
Bioanalyzer
Electrophoretic analysis of samples will be performed on the Agilent 2100 Bioanalyzer. The bioanalyzer is a microfluidics based platform that provides sizing and quality control of DNA and RNA. Analysis is performed on Agilent's Lab-on-a-Chip technology where loaded biomolecules are driven by a voltage gradient through a mixture of sieving polymer and fluorescent dye. Target molecules are separated by size similar to traditional slab electrophoresis. Dye molecules intercalate into the target molecule strands and these molecules are detected by laser-induced fluorescence. Final data is translated into gel-like images and into an electropherogram (see below).


The electropherogram diagrams fluoresce over time and can be used to assess sample quality. High quality sample electropherograms show the following: 1) clearly defined sample peaks, 2) low noise between sample peaks, and 3) minimal low molecular weight noise. In addition, the electropherograms are helpful in detecting adapter dimers, PCR artifacts, and SPRI bead carryover following PCR clean up.
The bioanalyzer will also provide fragment size (in bp) data and an RNA Integrity Number (RIN Number) to estimate the the integrity of total RNA samples.

General Information
- Analyze up to 12 samples in as little as 30 minutes (depending on kit type; see below)
- Ready-to-use assays and reagent kits
- Requires only 1 µL of sample
Tapestation
Electrophoretic analysis of samples will be performed on the Agilent 2100 Bioanalyzer. The bioanalyzer is a microfluidics based platform that provides sizing and quality control of DNA and RNA. Analysis is performed on Agilent's Lab-on-a-Chip technology where loaded biomolecules are driven by a voltage gradient through a mixture of sieving polymer and fluorescent dye. Target molecules are separated by size similar to traditional slab electrophoresis. Dye molecules intercalate into the target molecule strands and these molecules are detected by laser-induced fluorescence. Final data is translated into gel-like images and into an electropherogram (see below).
The electropherogram diagrams fluoresce over time and can be used to assess sample quality. High quality sample electropherograms show the following: 1) clearly defined sample peaks, 2) low noise between sample peaks, and 3) minimal low molecular weight noise. In addition, the electropherograms are helpful in detecting adapter dimers, PCR artifacts, and SPRI bead carryover following PCR clean up.
The bioanalyzer will also provide fragment size (in bp) data and an RNA Integrity Number (RIN Number) to estimate the the integrity of total RNA samples.
General Information
- Analyze 1-96 samples at a time (20 samples take around 16 minutes).
- Ready-to-use assays and reagent kits
- Requires only 1 µL of sample
- One lane is used per sample
Sample Submission
If you are submitting samples to be analyzed on the bioanalyzer, please provide the following:
- ≥ 5 µL aliquot of sample in a nuclease-free tube (please DO NOT submit stock samples for analysis!)
- Sample concentration (ng/µL)
- Method of quantification
- Results of quantification
If your samples are too dilute or more concentrated than specified below, we will not accept your samples.
RNA
- For Eukaryotic total RNA, the RNA fragments detected are 18S and 28S
- For Prokaryotic total RNA, the RNA fragments detected are 16S and 23S
- RNA samples should be in nuclease-free water (we recommend Ambion Nuclease-Free Water (not DEPC-Treated) and within the sample concentration ranges listed below.
Functional Library Quantification
While the QC procedures listed above are informative, they are not necessarily representative of the portion of the sample that is able to be sequenced. The most difficult part of loading a sequencing run is quantification of the samples loaded on the instrument. Too much sample and too many clusters will be generated, potentially ruining the entire flow cell. Too little sample loaded causes very low cluster density and waste of valuable space on the flow cell. To precisely quantify the functional library molecules in a sample we use the Bio-Rad's QX200 Droplet Digital PCR System and probe sets specifically designed for the detection of the adapter sequences used in library construction.
QX200 Droplet-digital PCR (ddPCR) system combines water-oil emulsion droplet technology with microfluidics. The QX200 System consists of two instruments - a droplet generator and a droplet reader. The droplet generator partitions each sample into 20,000 uniform nanoliter-sized droplets in which nucleic acid molecules, in this case library molecules, are distributed in a random fashion. Droplets are then transferred to a 96-well PCR plate and PCR is performed in a thermal cycler. When loaded onto the reader, the fluorescence of individual droplets is read and recorded. Positive droplets, which contain at least one copy of the target DNA or RNA molecule, exhibit increased fluorescence compared to negative droplets. The fraction of PCR-positive droplets enables absolute quantification of only the molecules that contain functional adapter sets.

In addition to quantification, ddPCR is able to discern relative size of the library insert as well as adapter dimer contamination of the library prep using a fluorescence amplitude plot of droplet populations.